Design Project #1
(Last Modified: 27 November 2010 09:56:33 PM )
A test stand has been constructed to measure the thrust-versus-time characteristic for model rocket engines. The sensing element for this stand is a strain gage taken from an inexpensive electronic bathroom scale. This gauge is built into a simple lever system that serves as a load cell upon which the rocket engines are mounted.
Model Rocket Engine Test Stand Preamplifier
Your job is to design a pre-amplifier circuit that is powered by a single 9V alkaline-manganese battery. This preamp should drive the strain gage and generate a differential output voltage that is proportional to the rocket thrust.
You are completely free to design your circuit however you choose subject to the following constraints:
A potential starting point is the multistage amplifier in Fig 6.46 (p552).
The Model Rocket Test Stand is equipped with two strain gages. These are connected to three colored leads as follows:
Gage A: black/green; measured unloaded resistance near room temp is 1508 ohms
Gage B: red/green; measured unleaded resistance near room temp is 1362 ohms.
When a load of approximately four pounds was applied to the stand, the resistance of Gage A decreased by 28 ohms and the resistance of Gage B increased by 17 ohms.
Since these gages were salvaged from a commercial product and are of unknown origin, it is impossible to determine their operating limitations. However, strain gages of this type typically should not be excited with more than approximately 750mW/cm^2 if mounted on a good heat sink and about 150mW/cm^2 if mounted on a poor heat sink. The heat sink on this test stand appears to be bronze and so the thermal properties should be pretty good and a limit of about 500mW/cm^2 should be adequate. The area occupied by both strain gages (which appear to be co-located on the same substrate) is approximately 4mm by 4mm.
Battery Life: >10 hours for 9V Alkaline Battery
Output Transfer Function: 1 volt/pound
Minimum Input Range: 0lb to 5lb
Linearity: +/- 10%
Your circuit should allow for two adjustments - offset null and gain - so that the user can utilize the following sequence of steps when using the amplifier:
The above sequence assumes that Step 5 does not affect the calibrated gain established during Step 3 - in other words, it assumes that the two adjustments are independent of each other.
The above two adjustments are what the customer would like to see - they are customer-driven adjustability specifications. You may have additional adjustments that your design requires the customer to make. The customer may not want to be burdened with additional adjustments, and may be willing to pay more to have those adjustments be automatic. But if you determine that you need the user to, for instance, balance the circuit that is driving the stain gages, then you need to make that known, describe why the additional adjustment is needed and/or desirable and provide a set of steps to be followed in making the adjustment.
- differential input resistance:
- output resistance:
- differential gain:
- common-mode input range:
- output range:
- input bias current:
- input offset voltage:
- quiescent power:
Although the physical test stand exists and can be made available for testing, you actually have all of the information you need in order to construct a simple simulator. This will save wear and tear on the test stand (not the most durable piece of equipment to begin with), will prevent a bottleneck of people trying to test their hardware, and will greatly reduce the likelihood that someone will inadvertently destroy the strain gages by applying too much voltage to them.
The key to constructing a simulator is to understand what your preamplifier is interfaced to - a resistor. The fact that the resistor is part of a load cell mounted in a lever system is irrelevant since your circuit merely sees a resistance that happens to change a little bit from time to time. So all you need in order to simulate this changing resistor is - a resistor that changes.
The simplest thing to do would be to use a potentiometer configured as a rheostat (variable resistor). In theory this would work but, in practice, would be very difficult to use because we are talking about very small changes in resistance - on the order of one to two percent. If you used a 2kohm ten-turn potentiometer and adjusted it 1500 ohms as your nominal resistance, the additional motion needed to cover the full range of resistance change would only be about one tenth of one turn. Not very practical at all.
Another, much better but still highly flawed, means would be to place a fixed resistor in series with a much smaller variable resistor. Your fixed resistor would be about 1500 ohms and you would need to find a potentiometer that was only twenty to thirty ohms. They are not very common but they do exist. The problem here is in calibration. You want to simulate a load of a specific amount and if you have to adjust the potentiometer each time the desired load changes it becomes very inconvenient.
Another means is to use a fixed resistance that is the highest resistance you want to simulate and then use switched resistors in parallel with it to cause controlled decreases in resistance to simulate the effect of loading or unloading.. This allows you to used fixed resistors of considerable resistance in your simulator.
Consider the following problem:
You have a strain gage with a nominal resistance of RO and wish to place another resistor RX in parallel with it such that the effective resistance of the combination is reduced by y% from the nominal value. What is the required value for RX? This is really all there is to it. Using this principle you should be able to construct a simulator with just a few resistors and a few switches that will allow you to simulate several different loads.
BACKGROUND MATERIAL and INFORMATION RESOURCES
The strain gages in the test stand were placed into a bridge circuit such that the common point of the gages was tied to the positive terminal of a 9V power supply and the other end of each gage were tied to the fixed resistance ends of a 2000 ohm potentiometer. The wiper of the potentiometer was tied to the negative terminal of the supply. The result is a classic Wheatstone Bridge circuit with the output being taken across the fixed terminals of the potentiometer.
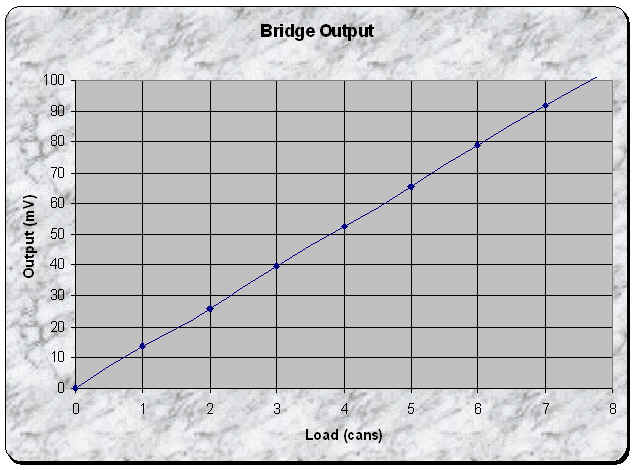
A millivolt meter was placed across the output of the bridge and the potentiometer adjusted until there was 0.0V across the output terminals. Then, using unopened soda cans as test weights, the following data was taken:
| Cans | Output (mV) | dOut (mV) |
| 0 | 0 | n/a |
| 1 | 13.7 | 13.7 |
| 2 | 25.7 | 12 |
| 3 | 39.8 | 14.1 |
| 4 | 52.5 | 12.7 |
| 5 | 65.3 | 12.8 |
| 6 | 79.2 | 13.9 |
| 7 | 91.8 | 12.6 |
| 8 | 104.2 | 12.4 |
Since each can of soda weighs approximately 12.5 oz, eight cans is approximately 6.25 pounds.
As can be seen, the raw output of the test stand is reasonably linear, as indicated by nearly constant output changes as each additional can of soda was added. On average, each can of soda caused a change of 13.0mV in the output. The worst cases shown above are at 2 cans and 3 cans with incremental changes that are 7.8% less and 8.5% greater than the average respectively.
Simple One-Stage Amplifier Performance
A very simple one-stage differential amplifier was constructed and interfaced to the bridge circuit described above. After nulling the circuit and adjusting the gain so that two liters of water produced a reading of 4.00V, data similar to the above was taken and the following results recorded:
| Cans | Output (V) | dOut (mV) |
| 0 | 0 | n/a |
| 1 | 1.75 | 1.75 |
| 2 | 3.16 | 1.41 |
| 3 | 3.75 | 0.59 |
| 4 | 3.88 | 0.13 |
| 5 | 3.96 | 0.08 |
| 6 | 4.05 | 0.09 |
| 7 | 4.10 | 0.05 |
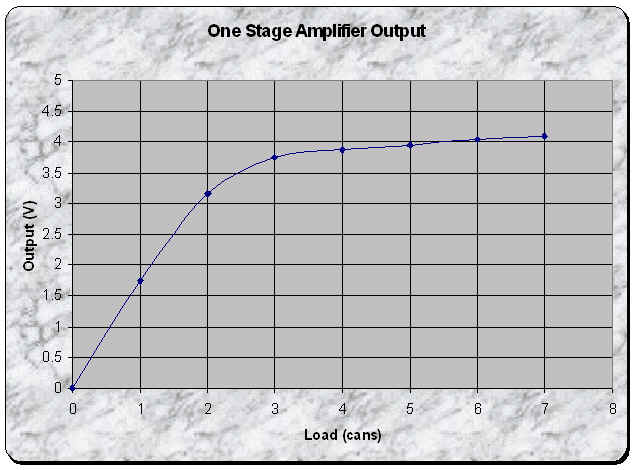
As can be easily seen, the output is highly nonlinear. If you can figure out the most likely cause for this behavior, then you are well on your way to solving this problem.
After redesigning the circuit to reduce the nonlinearity, the following was observed as the output of the modified bridge:
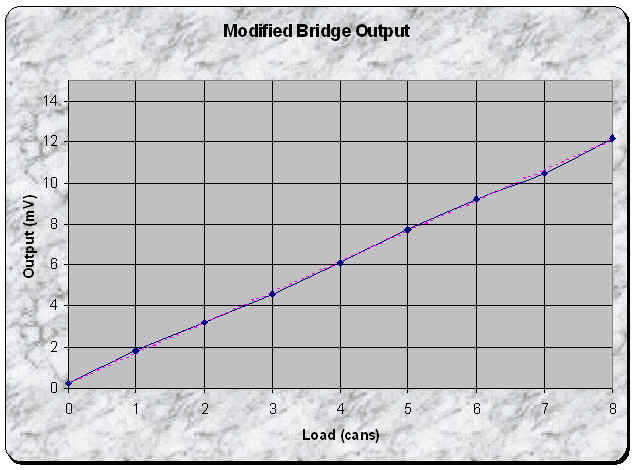
You can see that it is still quite linear - the dashed line is the Least Squares best fit line.
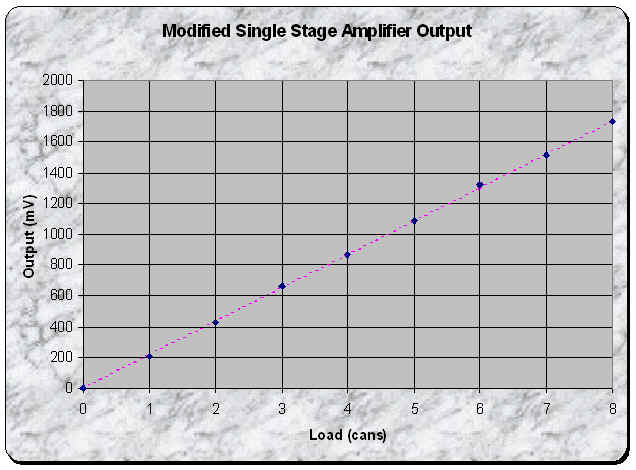
The following is the differential output from the single stage amplifier. This amplifier was biased at a considerably lower current than the prior design. The design gain for the stage was 168 V/V and the measured gain was 146 V/V. It is readily apparent that this stage has significantly improved linearity, although it does not meet the total gain requirements of 1V/lb. However, it was never intended to and with an actual gain of approximately 0.28V/lb, the second and final stage only has to achieve of gain of approximately 3.5 V/V.
While there is still another stage to implement, the present current draw from a 9V source is consistent with this circuit being able to last approximately 100 hours on a 9V alkaline battery.
The expected battery life under different loading conditions can frequently be found on the battery manufacture's website. What you are looking for is how much total current can be drawn from the battery on a continuous basis and have the terminal voltage remain above the cutoff voltage for a minimum of ten hours. The cutoff voltage is that voltage below which your circuit will no longer meet the remainder of its performance specifications. Since this is rather difficult to determine at the beginning of a design, it is frequently assumed that the cutoff voltage is 90% of the battery's fresh voltage unless some factor argues for a different value. This issue should be revisited later as the design progresses and it becomes more feasible to estimate, simulate, or measure a better value for the cutoff voltage.
There are many different ways of specifying and measuring linearity. is a rather nebulous. For our purposes, the output of your circuit should be simulated/measured for ten different weights evenly spread over the operating range. The slope between each successive pair of data points can be calculated and should be within the 10% linearity specification. To get a good feel for if your circuit is likely to meet this spec, you can perform a much quicker test. Simply null the circuit, place a weight that is roughly half of the intended full scale range on the scale and record the weight. Then add a second, identical weight and record the new reading. If the half of the new reading is not within 10% of the previous reading, then you are not within spec.
While the most obvious way to get a differential output is to take the outputs across the collectors of a differential pair, there are other ways of achieving this. One method is simply to take a single-ended output from the amplifier as one output and a fixed voltage as the other output. The fixed output can then be adjusted to match the active output under zero load conditions in order to null the amplifier. This is admittedly a crude way of getting differential outputs and in doing this you lose most, but not all, of the benefits of having a differential output in the first place. Another means of obtaining differential outputs is to treat each side of the differential output pair as a single-ended output into separate single-ended input amplifiers driving two outputs. This approach preserves most, but not all, of the benefits of the differential output.